Demystifying General Local Aid in Massachusetts
January 20, 2012To accompany this report, we have created an interactive tool that allows you to track the amount of general local aid going to each municipality in the Commonwealth.
WHAT IS LOCAL AID?
The term "local aid" refers to money that flows from the state budget to city and town budgets, helping them fund vital local services such as schools, police and fire protection, parks, and public works. Massachusetts is made up of 351 separate cities and town governments, whose levels of wealth range widely—from low-income gateway cities to high-wealth residential suburbs—and, yet, each of them is charged with providing similar levels of vital public services. State government in Massachusetts uses general local aid as a mechanism for helping offset inequality of local services that would otherwise exist if these cities and towns primarily funded their budgets with local property tax revenue.Massachusetts limits the ability of cities and town to raise local revenue more than many other states.1 Proposition 2½ dramatically constrains the ability of cities and towns to raise revenue through local property taxes.2 Additionally, various provisions in the Massachusetts State Constitution restrict or prohibit cities and towns from levying local taxes such as sales, income, hotels, and meals taxes. State-granted permission to levy these local taxes has been rare, although recently, in FY 2010, the Legislature passed a law allowing localities to adopt a small local option meal tax and to raise hotel taxes from 4 to 6 percent.
Cities and towns in Massachusetts end up relying heavily on local aid from the state, with roughly 20 percent of municipal general fund revenue in FY 2011 coming from all forms of local aid combined (including Chapter 70 education aid). In FY 2011, local aid comprised more than one-third of municipal revenues for 39 predominantly lower-wealth municipalities in Massachusetts.3
WHAT ARE THE DIFFERENT FORMS OF LOCAL AID?
In Massachusetts, local aid that flows from the state to local governments falls into three basic categories:- General Local Aid. Cities and towns use general local aid for funding general government services, with broad leeway to distribute this money for programs across their local budgets. For many years, general local aid came in two forms, Lottery Aid (revenue from state lottery profits) and Additional Assistance. In FY 2010, these two programs were combined and became Unrestricted General Government Aid. Some cities and towns receive other forms of unrestricted general aid—including payments in lieu of taxes to communities with state-owned land that is not subject to local property taxes and payments to a few communities with race tracks—but these represent much smaller total amounts and only go to a subset of qualifying cities and towns.
- Chapter 70 Education Aid. Chapter 70 aid is by far the largest portion of local aid—$3.99 billion in FY 2012—and instead of going to city or town budgets, this money flows directly from the state to each of the 328 individual operating school districts. Districts' individual Chapter 70 aid amounts are determined using a uniform set of standards that factor in student need and local capacity to raise revenue, ultimately getting distributed in a progressive manner, meaning that districts with a greater gap between student need and local resources receive greater aid.4
- Categorical Local Aid. Cities and towns also receive financial support through a variety of smaller programs that are targeted to specific uses, such as libraries and veterans programs.
HOW DOES THE STATE DISTRIBUTE GENERAL LOCAL AID?
Over the last three decades, the state has used a few different formulas for distributing pots of general local aid. During the 1980's and early 1990's the state distributed Chapter 70 aid, Lottery Aid (although lottery profits were smaller during these decades), and Additional Assistance. Originally, Chapter 70 education aid amounts were considered when distributing general local aid, but the Education Reform Act of 1993 dramatically changed the Chapter 70 program and mostly separated it from general local aid calculations. Starting in FY 2010 the Lottery Aid and Additional Assistance were merged into one Unrestricted General Government Aid program. Each of these programs is described below.Lottery Aid
Since property taxes are the primary source of local revenue in Massachusetts, and since property wealth varies widely across communities, the Lottery Aid formula was designed to have an equalizing effect, with lower property wealth cities and towns receiving more state aid (in per capita terms).With its simple structure, the lottery formula is generally progressive in that lower-property wealth communities receive more aid. By only considering property wealth, however, it accounts for neither other sources of wealth nor local variations in the cost of providing services.
Additional Assistance
In the early 1980's the state created a needs-based local aid formula whereby the state calculated each city and town's need (the estimated cost of providing local services) and contrasted this with the community's revenue capacity (the ability to raise local tax revenue to meet its needs). Since this program predated the comprehensive Chapter 70 formula created in FY 1993, the formula included school costs among its need factors.5 Additional Assistance was initially a residual aid program, designed to help fill the gap between the state's calculation of total local aid for a community and its Chapter 70 aid amount.Additional Assistance has been mired with problems over the past couple of decades. In FY 1992, the state stopped using the needs-based formula for allocating Additional Assistance and instead either level-funded city and town appropriations (in nominal terms) or cut them. This meant that during the intervening 18 years, the state never reevaluated underlying community-level data, such as local property values, in order to adjust for local demographic and fiscal changes. Furthermore, the needs-based formula itself may never have captured an accurate range of true cost and capacity differences. The relative merits of variables included in the formula have always been disputed.
Unrestricted General Government Aid
Acknowledging that whatever underlying logic Additional Assistance once reflected has long since been lost, the Legislature in FY 2010 merged it with Lottery Aid and created the new Unrestricted General Government Aid (UGGA) program. It is important to note that the move to a single UGGA appropriation did not reflect a substantive reform of general local aid; UGGA has never had a formula of its own, since previous years' aid amounts have either been cut across the board (FY 2010 and FY 2011) or level funded (FY 2012).6 These previous year amounts originate from the sum total of each individual community's FY 2009 Lottery Aid and Additional Assistance allocations.HOW HAS LOCAL AID BEEN CUT DURING THE FISCAL CRISIS?
A series of state-level tax cuts during the 1990's and 2000's combined with the onset of the Great Recession in 2007 to create ongoing budget deficits in Massachusetts, with revenues well below the cost of providing baseline state services. These deficits have forced deep cuts across state government. As a discretionary program that funds local services not administered directly by state government, statewide general local aid has been cut severely during this ongoing state fiscal crisis. Adjusted for inflation, general local aid was cut 36 percent from the end of FY 2008 through FY 2012, more deeply than many other state programs. It is worth noting that since local aid is just one source of revenue for cities and town, cutting this one source of revenue by 36 percent results in a smaller total percent reduction to overall municipal budgets.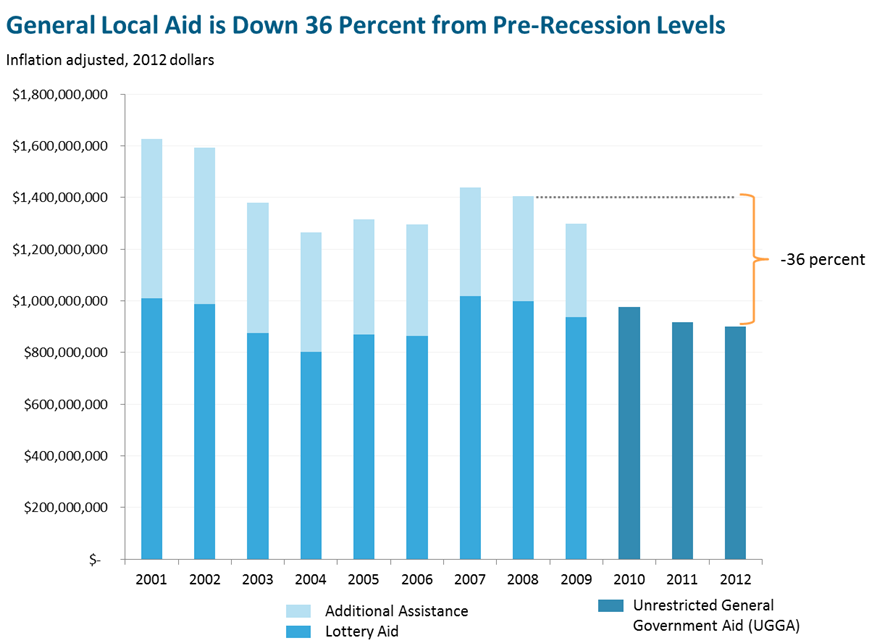
The FY 2012 budget actually cut the statewide UGGA appropriation by $65 million from nominal FY 2011 levels ($899 million to $834 million), but it then directed 50 percent of all unexpended FY 2011 balances from general fund spending (up to $65 million) as of June 30, 2011 to be distributed to cities and towns proportionally to their individual cuts. Unexpended FY 2011 fund balances proved sufficient to reverse the full $65 million cut amount, so that after the dust settles, cities and towns in FY 2012 will receive the same total UGGA appropriation of $899 million that they received in FY 2011. The FY 2012 budget is clear, however, that the $65 million distributed from unexpended FY 2011 balances towards the $899 million total is to be considered one-time grants, and should not be considered part of baseline aid used for determining future local aid allocations.
On January 20, 2012 the Governor announced his FY 2013 budget proposal for Unrestricted General Government Aid, and it mirrors the approach adopted for FY 2012; UGGA would be funded at a baseline level of $834 million, with a likely $65 million addition pending sufficient FY 2012 unexpended fund balances. It should be noted that even if UGGA is funded at the full $899 million in FY 2013, this nominal level funding is tantamount to a cut since no inflation adjustment would have been made to keep up with rising costs.
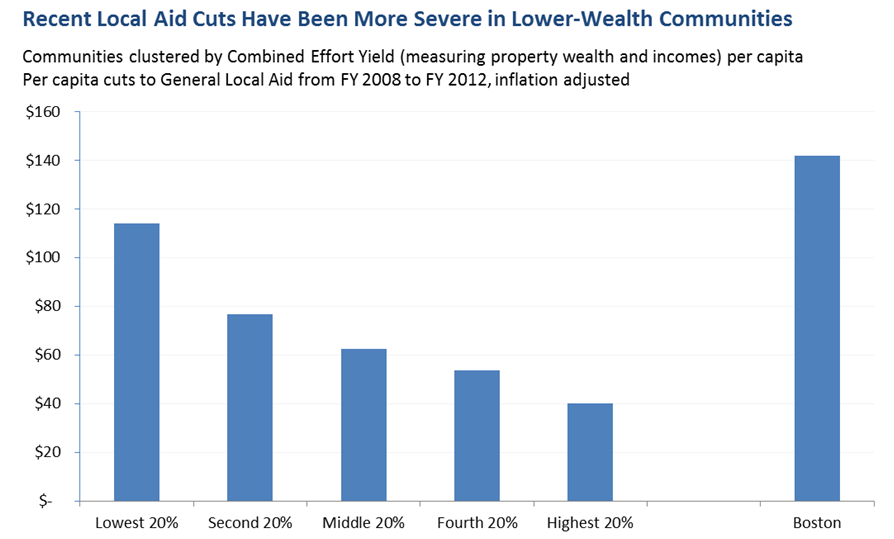
Due to the progressive nature of general local aid in Massachusetts, across-the-board cuts of 36 percent have resulted in much larger dollar cuts for lower-wealth communities. The least wealthy 20% of cities and towns, for example, have experienced cuts of $114 per capita, whereas cities and towns in the highest 20% have seen cuts of less than half that amount at $40 per capita. Because Boston traditionally received large amounts of Additional Assistance, and because remnants of these allocations are built into their current Unrestricted General Government Aid, across-the-board percent cuts have led to especially large general local aid cuts for Boston—$142 per capita since FY 2008.
Larger per capita cuts to lower-wealth cities and towns are further challenging for these communities since general local aid tends to compose a larger proportion of their total municipal budgets. The interactive tool below allows you to identify per capita cut amounts by city or town.
HOW SHOULD GENERAL LOCAL AID BE REFORMED?
Discussions of changes to local aid distributions have generally assumed that in adjusting the relative amounts of cities and towns no community's distribution should be cut in order to increase another's. This "hold harmless" principle helps ensure budgeting predictability for all cities and towns and helps ensure that no community experiences disproportionately large cuts in any given year. An important downside to this hold harmless approach, however, is that all reforms to relative aid distributions can occur only when new revenue is available. If new revenue does become available over the next few years, either as the result of policy changes or strong economic growth, the Legislature would finally have new money to help increase communities' general local aid amounts above their current depressed levels. If new money does become available, an affirmative decision will have to be made about how to distribute it.
Once casino licenses have been sold and facilities are up and running, the November 2011 casino law is expected to generate new general local aid revenue. While legalized casino gambling facilities will provide some new tax revenue, the state also expects lottery revenues to decrease somewhat as some gambling activity shifts from lottery sales to casinos. For both of these reasons, the new gambling law distributes a portion of future gambling tax revenue to cities and towns in the form of new general local aid. All tax revenue from the slots-only facility and 20 percent of tax revenue from the three full-scale casinos will go into a new Gaming Local Aid Fund and into a related Local Aid Stabilization Fund. Revenue distributed from these funds will be distributed to cities and towns as Unrestricted General Government Aid, but since UGGA funds have never been distributed using a formula, a policy decision will need to be made for distributing any of this new aid.
A few options for distributing new local aid above current baseline amounts include:
- Restore cuts since FY 2008. Since general local aid has been cut 36 percent across-the-board, the Legislature could distribute new aid in direct proportion to individual amounts cut. This strategy would be reasonably progressive since it would mirror the progressivity of the system prior to cuts. One downside to simply restoring recent cuts, however, is that this approach would bring communities back towards their specific pre-fiscal crisis levels, which include the remnants of problematic Additional Assistance allocations.
Additionally, restoring cuts would not include a recalculation of local capacity (and/or need), missing out on an opportunity to ensure that the state's aid distributions best reflect changing local circumstances. - Use the existing Lottery Aid formula. The state could distribute all lottery revenue directly through the Lottery Aid formula, which distributes aid based on local property values, giving more aid to communities with less property wealth. Since the lottery formula is already written into state law it could be used quite easily. Furthermore, the formula is quite simple and would give the state an opportunity to use updated property assessments to help reflect current local conditions. If the Legislature identified new revenue for general local aid in addition to revenue from lottery profits, that additional money could be distributed through some new mechanism, such as a formula that considers capacity and need (see option #3 below). Alternatively, the Legislature might consider using the Lottery Aid formula, but with one important adjustment: using a combined measure of property values and income levels, similar to the Combined Effort Yield measure used by the Massachusetts Department of Elementary and Secondary Education in determining required local contributions for K-12 education.
- Create a new formula that considers local capacity and need. The state has not used a formula that considers current differences in local need since the early 1990's. If the state determines that the cost of providing a baseline level of local services varies not just based upon population but also based on other local conditions, such as poverty and unemployment, then it could opt for including within the formula variables that capture local need. Bo Zhao, Senior Economist at the New England Public Policy Center at the Federal Reserve Bank of Boston, has proposed a new gap-based formula, which contrasts a calculation of local costs with local capacity for every city and town and distributes new aid in proportion to the size of a community's gap.8 Specific variables and weights included in Zhao's model are based upon detailed regression analyses that attempt to isolate true baseline costs. It is unclear whether such an analysis can adequately distinguish between cost differences among communities that are driven by objective factors that reflect true needs and those that are the result of policy choices. Some factors included in Zhao's model, such as poverty and unemployment, seem intuitively appropriate for identifying higher municipal costs; others, such as density, seem to merit further investigation. It could be, for example, that a few of the larger, denser communities in Massachusetts have simply chosen to spend more than other communities. The state would want to be make certain that any regression model used for reforming local aid adequately controls for these sorts of preferences and, alternatively, doesn't penalize communities that provide services more inexpensively.
Rather than relying strictly on a statistical model for creating a new gap-based formula, the state could take a model like Zhao's and use that not as an end in of itself, but as the basis for an expert analysis of what cost drivers truly are and how they vary across the state.
1 For a comparison of Boston's legal powers to those of several other American cities, see The Boston Foundation's report Boston Bound, by Gerald Frug and David Barron, February 2007, available online at: http://www.tbf.org/uploadedFiles/Boston%20Bound_8.pdf
2 For more information on Proposition 2½ see the Property Tax section of MassBudget's Understanding Our Tax System: A Primer for Active Citizens, by Kurt Wise and Noah Berger, available online at: http://www.massbudget.org/report_window.php?loc=Tax_Primer_83110.html
3 This summary data on all local aid as a percent of municipal revenues comes from the Department of Revenue's Municipal Budgeted Revenues by Source spreadsheet available online at: http://www.mass.gov/dor/docs/dls/mdmstuf/municipalbudgetedrevenues/revs11.xls
4 For more information on how the Chapter 70 formula works, please see MassBudget's Facts-At-A-Glance, Demystifying the Chapter 70 Formula—How the Massachusetts Education Funding System Works, available online at: http://www.massbudget.org/documentsearch/findDocument?doc_id=762&dse_id=1385
Additionally, MassBudget recently released a paper comparing foundation budget allocations to actual spending in all 328 Massachusetts school districts. This paper, Cutting Class: Underfunding the Foundation Budget's Core Education Program is available online at: http://www.massbudget.org/report_window.php?loc=Cutting_Class.html
5 According to the Department of Revenue's FY 1989 Cherry Sheet Manual, cost factors included in the needs-based formula were: weighted full-time/equivalent students, population density, local road mileage, manufacturing employment, non-manufacturing employment, percent of persons in poverty, percent of housing built before 1940, and service level group. Capacity factors used were: property tax capacity, available reserves, motor vehicle excise tax, cherry sheet aid, hotel/motel tax capacity.
6 The FY 2012 budget funded Unrestricted General Government Local Aid at $834.0 million, a decrease of $65.0 million from FY 2011. Importantly, however, the budget included language directing 50 percent of all unexpended FY 2011 balances from general fund spending (up to $65.0 million) as of June 30, 2011 to be distributed to cities and towns, offsetting proposed cuts in local aid for FY 2012. Unexpended fund balances turned out to be large enough to fully offset the original $65 million cut, ultimately resulting in level-funding. It is important to note, however, that local aid distributions made from unexpended FY 2011 balances are considered one-time grants, and will not necessarily count towards baseline aid used for determining future local aid allocations.
7 While the vast majority of cities and towns received an across-the-board cut of 29% in FY 2010, the Legislature did consider other new sources of local tax capacity that were simultaneously approved through the FY 2009 budget. The Legislature reduced somewhat the size of cuts for smaller, more rural communities that were deemed unable to raise significant revenue from the newly approved local option meals tax, the increase in the local option lodging tax, and the elimination of a property tax exemption for telecommunications poles and wires.
8 For detail on this proposed formula, see Does Springfield Receive Its Fair Share of Municipal Aid? Implications for Aid Formula Reform in Massachusetts, by Bo Zhao, New England Public Policy Center Working Paper No. 10-4 available online at: http://www.bos.frb.org/economic/neppc/wp/2010/neppcwp104.htm
No comments:
Post a Comment